Having previously presented my view of the apple industry, this article presents my view of the pear industry.
Let’s start with the number of establishments in Australia’s pome fruit industry.
In 1998 there were 1279 apple and pear growing establishments; by 2011 there were 731, a decrease of 43%, or 42 establishments a year. These figures equate to an annual average decrease of 3%.
To put this into context, the consolidation of all other agricultural industries during the same period was 6%. The pome fruit industry is consolidating at a much faster rate than agriculture in general.
Where has the consolidation occurred? If we take the decline of 43% as the national average, then: Queensland and Tasmania’s decline was about 55%; New South Wales, 46%; Western Australia, 43%; Victoria, 38%; and South Australia, 28%.
Drop in area grown
To focus these figures a little: in 2002, pears were grown on 5403 hectares; by 2008, the area was 4393 (APAL). These figures equate to an annual decrease of 3% (the equivalent decrease in apple area was 5%).
Decline in establishment size
If we consider establishment size, between 1998 and 2011 apple and pear growing establishments declined across each size range. In fact, the proportion of establishments in the 0–49 hectare size increased, whilst the relative proportion of larger establishments decreased—which suggests that consolidation may be occurring more in the small to medium sector, rather than at the top end.
Some 85% of the national crop is grown in the Goulburn Valley region of Victoria and a significant proportion of production traditionally went to the SPC and Ardmona processing plants. However, processing intake has steadily declined and this has resulted in more areas of WBC trees being pulled out, as witnessed on many blocks around Shepparton.
 The production base
In 1998, there were 1.38 million pears trees over six years old; by 2011 the number was 1.63 million.
In 2002, average pear tree density was 243trees/hectare; by 2008 the density was 394 trees/hectare. Although pear block renewal is taking place, even as the number of pear orchards is declining, plantings in general could not be considered high density.
This is probably a realistic economic strategy by growers but, from an industry viewpoint, it will not greatly assist us to match competitor yields, and increasing yields have been fundamental to agricultural profitability in Australia.
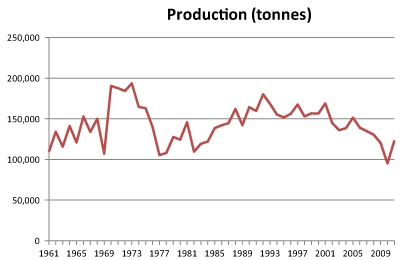
Production Volume
Figure 1 presents about 50 seasons of pear production. As a general overview, production increased between 1961 and 1991, but has since declined to the same levels as in 1961. In other words, over a period of 50 years the industry has not grown.
As a general comment, a business or an industry that does not grow is one that will be vulnerable to competition and cost pressures. However, size may not be everything, and a small industry may still be a profitable industry. Good profits build strength.
Consumption
During the past six seasons, average production has been about 125,000 tonnes.
This production goes to two markets: domestic (including processing)and export. SPC Ardmona has discontinued exports of processed pears in recent years.
Export
In 2000, the industry exported about 20,500 tonnes, or 13% of production. Since then, export volumes have declined and were about 5600 tonnes in 2011, or 4.5% of production.
As I suggested in a previous article about apples, the single focus on our appreciating dollar as being the main reason for export decline is simplistic.
In 2000, I visited South Africa to talk to pear growers about their export trade into South-East Asia. Although I was ostensibly there to talk about a less combative approach to pricing between our industries, the reality I found at each business and agency was that Australia just did not figure on their radar as being any sort of meaningful competitor.
They had no idea of what the Australian pear price was—because it didn’t matter to them; we were an Australian gnat competing against a South African elephant.
I repeat the same opinion I put forward for apples. We essentially do not have a robust export sector; we have never needed one because imports of fresh pears are largely prohibited.
We have steadily withdrawn from export markets, and it will be very difficult to get back in again.
Export trade is as likely to depend on consistent quality, good trade relationships and a persistent attitude, as much as on cyclical issues such as exchange rates or seasonal conditions.
Recently, containers of South African pears were refused in the US because of poor quality, so their industry doesn’t get everything right.
Flat domestic consumption
Apparent domestic consumption of pears has remained steady at about 6 kg per head (half that of apples), although such a figure is a little meaningless when national production is declining.
A key issue for the pear industry is that world consumption is declining at a time when diets include higher proportions of fruit and vegetables. Unlike other fruits, few new pear varieties are emerging and consumers tend to be in the older demographic range. Although some investment has been made into variety development, this is a slow road at the moment.
Yield
Australian agriculture has suffered declining terms of trade for at least 20 years (Productivity Commission). That is, crop input costs have risen faster than crop returns.
Yield has been the vital factor that has allowed Australian farmers to maintain or increase their income, and horticulture is no exception to this need.
Figure 2. presents my view of pear crop yield. The hectares from 2002 to 2008 are based on published data; the hectares for 2009 to 2011 are based on my assumption of a continuing 3% annual contraction in pear area.
Average yield has slowly increased to about 30 tonne/hectare, but this is substantially less than the Austrian yield of 71 tonne/hectare noted in an APAL situation analysis for the pear sector.
Although planting densities have increased from 243 trees/hectare to 394 trees/hectare this does not indicate any degree of intensive planting. Research into intensive plantings has already been undertaken (van den Ende) but pears are still perceived to have too long an immature period to warrant such investment.
If market returns are static, growers will suffer reduced profitability unless they can increase marketable yield. This is happening, but too slowly.
Returns
Figure 3 presents annual average gross value per kilogram – all at 2011 values (based on the annual CPI indices for food).
As previously noted, the data prior to 2005–06 is taken from a different database to that used from that year on. The addition of a trend line shows an upward movement in value between 2001 and 2011, which is good.
The sudden increase in 2011 may be a statistical aberration, or it may reflect a higher proportion of pears being sold on the fresh market as processing intakes decline.
At about 90 cents/kilogram pears are at a significantly lower price point than apples. Again, the incidence of processing pears is likely to have an effect on average price.
The increase in market control by Coles and Woolworths will continue to influence industry development. Their strategies will drive fewer suppliers, greater control of the supply chain to gain economic efficiencies, and a strong push for market growth driven by price discounting on key consumer products.
The outcomes from these are already being felt by horticulture farms that supply food processors— processed fruit being a prime example.
Despite the general angst felt by the farming community in this environment, there will be fruit businesses which will benefit from new alliances.
One factor which influences returns is that of new variety development. In a consumer society which constantly demands new experiences there is generally an increase in return when a new product/variety is introduced.
Witness the development of baby vegetables, and staple vegetables which now come in a variety of colours (such as purple cauliflower). New pear varieties take a long time to develop, but continuing to do so will be an important part of the industry’s future.
The Income Equation
Gross farm income is derived from a simple equation:
Gross Income = Area (hectares) x yield (tonnes per hectare) x return (dollars per hectare)
For a grower to increase his gross income, he must increase any one, or a combination of these elements. Alternatively, if a grower cannot increase any of these elements then his net income (gross income less costs) must decline, given rising costs.
My previous analysis indicates that:
- Planted area is declining at about 3% per year, and production is declining. This situation is likely to continue as the growing sector absorbs the full implication of declining processing intakes
- The broad agricultural experience is that increased yield is vital for maintaining or increasing gross income. Average pear yield is increasing very slowly;
- Average gross unit value is quite variable and sits in a band between 80 cents and $1 per kilogram.
At this stage, I think that data indicates an industry that might be maintaining its rate of gross income, but may not be increasing it.
Given that annual costs will be increasing, my overall view is that pear growers would be working hard to increase their income each season, and this is not helped by recent price volatility.
Numbers of establishments are regularly closing down and, although some businesses are growing through acquisition, planted hectares are also declining.
Profitability
The grains, dairy and livestock industries are made up of businesses that sell common products into common markets. Although there are certainly differences between individual businesses there is a lot of published data about farm profitability.
That is not the case for horticulture. Individual marketing skills make all the difference between a good return and a poor one and there are different supply chains that growers may use. As a result, horticultural growers have traditionally been protective about their financial results and there is little published data.
One study is that conducted for Murray-Darling Basin irrigated farms in 2009–10 (ABARES). Across a period of three years, 2009 to 2011, Basin horticultural business profit was projected to decline from a small profit to a significant loss.
To refine this a little for pome fruit, this scenario was mirrored exactly by the sample horticultural farms in the Goulburn-Broken catchment. Rate of return was projected to decline from 1.6% to –0.2%
Some years ago I undertook a detailed study of financial outcomes between 2001 and 2006 for canning pear growers. During those six years the sample group produced an average return on capital of about 5.5%, which is reasonable by agricultural standards (increases in land prices have generally accounted for a further 3% return per year).
The same study indicated that operating surplus was about 7 cents/kilogram. Given a potential gross price range movement of 20 cents/kilogram, pear profitability is likely to be quite variable.
Debt
In a difficult business environment it is vital that debt is managed well. However, profits are the biggest contributor to managing debt and, if profitability is declining, debt must increase.
It also becomes harder to invest in new plantings and technologies, and takes individual businesses to the point where they may not be able to survive a poor year.
Banks have tightened their lending protocols and once-ready credit is not there anymore.
The ABARES report identified that, between 2009 and 2010, the debt of the sample horticultural farms in the Goulburn-Broken catchment increased from $338,000 to $679,000. The ABARES sample may not be representative of general business, but it is one recorded viewpoint. Its finding also tends to confirm what many in the industry seem to feel—these are challenging times.
Conclusions
As for the apple industry,I think that pear industry data presents a sobering picture of difficult business conditions.
The challenges are: declining national production; declining consumption; the threat of imported fruit; low export volumes; consolidating supply chains; variable market returns; declining profitability and increasing debt.
Where apples are conducive to new packing technologies and varietal development, pears seem to be a very mature enterprise in that, much of the technological and varietal development has already happened and there are few new opportunities coming through.
Alternatively, despite the seeming maturity of pears, if significant import pressure affects the apple industry, those growers with pears may yet find that good old pears offer some tranquillity in an otherwise volatile and challenging pome fruit industry.
For all the graphs, see the September 2012 issue of Tree Fruit.