Let’s start with the number of establishments in Australia’s pome fruit industry.
In 1998 there were 1279 apple and pear growing establishments. By 2011 there were 731. A decrease of 43% or 42 establishments a year. These figures equate to an annual decrease of 3%.
To put this into context, the consolidation of all other agricultural industries during the same period was 6%. The pome fruit industry is consolidating at a much faster rate than agriculture in general.
Where has the consolidation occurred?
If we take the decline of 43% as the national average then:
- Queensland and Tasmania’s decline was about 55%
- New South Wales 46%
- Western Australia 43%
- Victoria 38%
- South Australia 28%.
To focus these figures a little: in 2002, apples were grown on 17,328 hectares. By 2008 it was 12,258 hectares (APAL). These figures equate to an annual decrease of 5%.
Declining establishment size
If we consider establishment size, between 1998 and 2011 apple and pear growing establishments declined across each size range.
In fact, the proportion of establishments in the 0-49 hectare size increased, whilst the relative proportion of larger establishments decreased, which suggests that consolidation may be occurring more in the small to medium sector, rather than at the top end.
Production base
In 1998 there were 5.3 million fully-bearing apple trees; by 2011 the number was 8.9 million.
In 2001, 37% of apple trees were immature, being the result of a significant period of replanting; in the years leading to 2008, immature trees typically represented about 15% of plantings but this proportion had increased to 27% by 2011, signifying another period of replanting.
In 2001, average apple tree density was 589 trees/hectare; by 2008 the density was 831 trees/hectare.
If I assume the same rate of planted area contraction as that of 2002–2008, then the average density by 2011 may be about 1100 trees/hectare.
One industry objective is to achieve an average density of about 2500 trees/hectare, to make us competitive with other countries by becoming more efficient.
Although our production base has increased during the past 13 years (even as the number of establishments was contracting), the data suggests that high-density planting is only being slowly applied and there is still some way to go meet the industry objective. At recent rates, it could take another 20 years to reach our target.
The expansion of tree numbers suggests that the industry may be facing an increase in national production that has to find a profitable home. However, after the large replanting surge in the late 1990s total production still plateaued at about 300,000 tonnes. The potential production story is still unfolding.
Production
Figure 1 presents 16 seasons of apple production.
During these years, average production was about 301,000 tonnes.
The standard view of many contemporary industries applies—the same output is being achieved by fewer operators.
To some extent this deserves a pat on the back. And if production stays static but efficiency improves, the industry has grown stronger.
Consumption
As noted above, data indicates that long-term industry production has been static, at about 300,000 tonnes per year. This production goes to two markets: domestic and export.
Exports
In 2000, the industry exported about 36,000 tonnes, or 11% of production.
There was a collapse in exports in 2003–04 when national production contracted significantly, possibly due to drought conditions and high prices for irrigation water.
Export trade has never recovered and was about 2400 tonnes in 2011.
The Aussie dollar & exports
A general view is that the Australian industry has suffered because of the steadily appreciating value of the Aussie Dollar against the US Dollar.
I can produce chart analysis suggesting that the increase in our currency value may be the reason for about 70% of the decline of Australian apple exports. However, I suggest that this view of currency and exports is simplistic.
Since industry deregulation in 2000, annual New Zealand apple exports have settled at about 300,000 tonnes year after year—that’s about 60% of production.
etween 2000 and 2011 I estimate that the Australian Dollar appreciated against the US Dollar by 79% (Reserve Bank). During the same period the New Zealand Dollar appreciated against the US Dollar by 77% (Reserve Bank of New Zealand).
Lack of export focus
My view is that we essentially do not have a robust export sector—we have never needed one because imports of fresh apples were prohibited.
We recently withdrew from what export markets we had during one bad season and have never really managed to get back in again, with an appreciating Aussie dollar not helping our cause.
However, the New Zealand experience suggests that exports can at least be maintained despite their appreciating dollar. Export trade is as likely to depend on consistent quality, good trade relationships and a persistent attitude, as much as on cyclical issues such as exchange rates or seasonal conditions.
Price trap
The problem for the industry now is that the fresh market is being opened up to imports.
Low domestic prices may impede import volumes for a while, but the issue is that we have no way of mitigating potential ongoing static returns if imported fruit helps to keep returns down.
Low export volumes also encourage the domestic wholesale and supermarket buyers to hold prices as low as they can because fruit is not going anywhere else.
Any increase in national production—without an increase in apparent consumption or exports— will be difficult for the industry to sell profitably.
Apparent domestic consumption of apples has remained steady at about 12–13 kg per head, although such a figure is a little meaningless when national production is flat anyway.
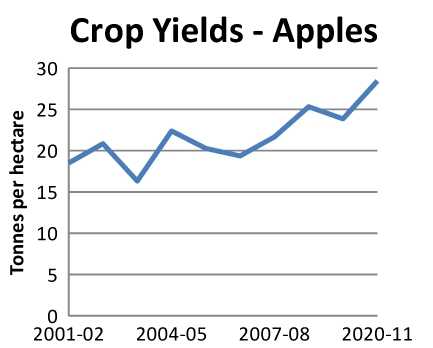
 Yield
Yield
Australian agriculture has suffered declining terms of trade for at least 20 years (Productivity Commission).
That is, crop input costs have risen faster than crop returns. Yield has been the vital factor that has allowed Australian farmers to maintain or increase their income, and horticulture is no exception to this need.
Figure 2 presents my view of apple crop yield. The hectares from 2002 to 2008 are based on published data; the hectares for 2009 to 2011 are based on my assumption of a continuing 5% annual contraction in apple area.
The outcome from higher-density plantings is beginning to emerge but there is still a long way to go.
In 2009 best practice was represented by examples such as New Zealand at 55 tonnes/hectare and Italy at 35 tonnes/hectare. Although we are beginning to close the gap, the reality will be that our competitors will also improve their yields over time.
However, given average Australian yield had been 15 tonnes/hectare, our orchards appear to have improved this aspect of efficiency.
Returns
Figure 3 presents annual average gross value per kilogram—all at 2011 values (based on the annual CPI indices for food).
As previously noted, the data prior to 2005–06 is taken from a different database to that used from that year on. The addition of a trend line shows an upward movement in value between 2001 and 2011, which is good.
However, between 2006 and 2011 I think it is fair to say that the rate of gross value has been fairly static, averaging $1.90/kilogram. This seems to bear out anecdotal evidence from growers who have been unhappy with recent prices.
Some issues are:
- Is this sort of gross value sufficient to provide a reasonable return on investment?
- Based on these values, does the resultant increase in yield justify the additional investment in high-density plantings, to encourage and hasten this trend?
- If returns are largely static but the costs of inputs are rising, what needs to happen for grower incomes to be at least maintained?
Supermarket influence
The increase in market control by Coles and Woolworths will continue to influence industry development.
Their strategies will drive fewer suppliers; greater control of the supply chain to gain economic efficiencies; and a strong push for market growth, driven by price discounting on key consumer products.
The outcomes from these are already being felt by horticulture farms that supply food processors—processed fruit being a prime example.
Despite the general angst felt by the farming community in this environment, there will be fruit businesses which will benefit from new alliances.
New fruit varieties
One factor which influences returns is that of new variety development.
In a consumer society which constantly demands new experiences there is generally an increase in return when a new product/variety is introduced.
Witness the development of baby vegetables, and staple vegetables which now come in a variety of colours (such as purple cauliflower).
New apple varieties take a long time to develop, but continuing to do so will be an important part of the industry’s future.
The drivers of income
The Income Equation
Gross farm income is derived from a simple equation:
Gross Income = Area (hectares) x yield (tonnes per hectare) x return (dollars per hectare)
For a grower to increase his gross income, he must increase any one, or a combination of these elements.
Alternatively, if a grower cannot increase any of these elements then his net income (gross income less costs) must decline, given rising costs.
My previous analysis indicates that:
- Planted area is declining at about 5% per year. The implication from this is that some growers are maintaining income by increasing their orchard area.
- However, orchard area is steadily declining for the industry as a whole and a significant number of apple establishments close each year
- Following some years of higher planting, the industry may be experiencing a noticeable lift in yield.
- Although it is some way behind those of our competitors, it does mean that more marketable fruit is being produced from each hectare.
- The broad agricultural experience is that increased yield is vital for maintaining or increasing gross income
- The situation for gross value is not clear-cut. Although the longer-run trend seems to be positive, average gross value during the last six years appears static—a ceiling of about $2 per kilogram and a floor of about $1.60.
Maintaining, but not increasing gross income
At this stage I think that data indicates an industry that might be maintaining its rate of gross income, but may not be increasing it.
Given that annual costs will be increasing, my overall view is that apple growers would be working hard to increase their income each season.
Numbers of establishments are regularly closing down and, although some businesses are growing through acquisition, planted hectares are also declining.
Profitability
Little published data for horticulture
The grains, dairy and livestock industries are made up of businesses that sell common products into common markets.
Although there are certainly differences between individual businesses there is a lot of published data about farm profitability.
That is not the case for horticulture. Individual marketing skills make all the difference between a good return and a poor one and there are different supply chains that growers may use.
As a result, horticultural growers have traditionally been protective about their financial results and there is little published data.
Declining rate of return
One study is that conducted for Murray-Darling Basin irrigated farms in 2009/10 (ABARES). Across a period of three years, 2009 to 2011, Basin horticultural business profit was projected to decline from a small profit to a significant loss.
To refine this a little for pome fruit, this scenario was mirrored exactly by the sample horticultural farms in the Goulburn-Broken catchment. Rate of return was projected to decline from 1.6% (positive)to –0.2% (negative).
My previous analysis indicates that gross value may have been static since 2006. In preparing this article I did not sight data about the trend in input costs for horticulture.
However, given that labour costs account for 50–60% of total costs, then annual cost increases may equate close to the annual inflation rate.
Australian agriculture has been experiencing declining terms of trade for 20 years. If horticulture is not dissimilar from other agricultural sectors it is likely that apple margins are also being eroded.
For businesses where yield is not increasing, profitability is likely to be declining.
Debt
In a difficult business environment it is vital that debt is managed well. However, profits are the biggest contributor to managing debt and, if profitability is declining, debt must increase.
It also becomes harder to invest in new plantings and technologies, and takes individual businesses to the point where they may not be able to survive a poor year.
Banks have tightened their lending protocols and once-ready credit is not there anymore.
The ABARES report identified that, between 2009 and 2010, the debt of the sample horticultural farms in the Goulburn-Broken catchment increased from $338,000 to $679,000.
The ABARES sample may not be representative of general business, but it is one recorded viewpoint. Its finding also tends to confirm what many in the industry seem to feel: these are challenging times.
Conclusions
I think apple industry data presents a sobering picture of difficult business conditions.
The challenges are:
- static national production
- the threat of imported fruit
- few exports
- consolidating supply chains
- static market returns
- declining profitability
- increasing debt.
- The opportunities will be found in:
- higher yields
- cost-efficient technologies
- new varieties
- forming business alliances
- a greater commitment to export markets.
There are businesses which are doing well, even as others are exiting the industry. Those successful companies are reading business signals effectively, investing in efficiencies, driving profits robustly, and staying in control of debt.
Many are being managed by young growers. I think their futures will be built on the next stage of industry development—the creation of more regional, national and international alliances; as was shown by the Pink Lady™ apple program.
To see the Figures mentioned in this article, download the August 2012 issue of Tree Fruit