Irrigation treatments (continued from last month)
Irrigation treatments
Two irrigation systems (drip and microjet) and two irrigation intervals (standard and pulse) were established and treatments were imposed in the 2012–13 (year 1) and 2013–14 (year 2) growing seasons.
Drip irrigation was applied by a single lateral located in the centre of the row with drip emitters delivering 1.75L/h and spaced at 0.5 m.
Microjet irrigation treatments were applied by a single lateral located in the centre of the row with microjet emitters delivering 32 L/h, spaced at 2 m midway between two trees and approximately 0.3 m above the soil surface.
Irrigation run time (Table 1) aimed to wet the soil to a depth of 0.3 m in the standard treatments. The pulse treatments applied one-third of the standard treatments.
Run time was calculated from the emitter rate, estimates of the wetting pattern and the water holding capacity of the soil.
The drip and microjet treatments at standard interval applied approximately 21 and 56 L/tree, respectively, at every irrigation event.
Irrigation frequency
Irrigation frequency was determined from estimates of crop evapotranspiration (ETc) according to Allen et al. (1998): ETc = Kcb Ke ETo
Where Kcb was the basal crop coefficient,
Ke was the soil evaporation coefficient and
ETo was reference crop evapotranspiration sourced from an automatic weather station approximately 50 m from the experimental site (weather.irrigateway.net).
Kcb = 1.3 EAS
where EAS was the effective area of shade (Goodwin et al. 2006) measured at regular intervals during the growing seasons.
Ke was set to 0.15 and 0.35 for the drip and microjet treatments respectively, based on wetting pattern size using the methods described in Allen et al. (1998).
Wetted soil volume
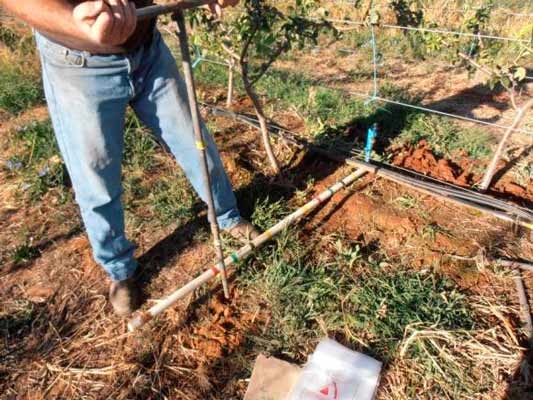
Soil samples were taken in mid-summer (days after bud burst = 166–167) in year 2 for the determination of soil water content and estimates of wetted soil volume.
A horizontal grid of samples at 0.1–0.25 m spacing between trees and rows were taken in one plot per treatment at depths of 0.1, 0.25, 0.4 and 0.55 m.
Sampling perpendicular to the row stopped at 0.55 and 1.2 m from the emitters in the drip and the microjet treatments respectively.
Soil samples were immediately placed in sealed containers, weighed, oven dried and then reweighed to determine gravimetric soil water content.
Volumetric soil water content (%) was estimated based on an A-horizon dry bulk density of 1.5 g/cm3 and a B-horizon dry bulk density of 1.7 g/cm3.
Wilting point was 13.2% at 0.1 and 0.25 m depth, and 25% at 0.4 and 0.55 m depths according to Cockcroft (1964).
Tree growth
Annual leader extension growth was determined by measuring the length of the two northern leaders per tree at the end of each season.
All vegetative material pruned during the growing season from the measurement trees in each plot was collected, oven dried at 65C for 72 h and then weighed.
Results
Volume
Approximately 290 and 500 mm irrigation were applied to the drip and microjet irrigation treatments, respectively, in year 1 (Figure 1).
There was a particularly dry spring in year 1 such that newly planted trees relied almost entirely on water delivered by the irrigation system.
Total ETo and rain during the season in year 1 was 1089 and 170 mm, respectively.
In year 2, slightly more irrigation was applied to all treatments as tree size increased, however, the amount applied to the drip treatments was still substantially less than the microjet treatments.
Total ETo and rain during the season in year 2 was 1026 and 250 mm, respectively.
Frequency
Average irrigation frequency was similar in spring and autumn but increased in summer (Table 1).
The drip-standard treatment was irrigated every 2 to 3 days in mid-summer whereas the drip-pulse treatment was irrigated once to twice daily.
Microjet treatments were less frequent than drip treatments. Average irrigation frequency did not differ substantially between years due to the dominance of soil evaporation in the calculation of irrigation requirement (see equation for ETc).
Stem water potential
Midday stem water potential (Ψleaf) was measured every 7–14 days between 1300 and 1500 h from 144 to 226 days after bud burst in year 1; and from 76 to 222 days after bud burst in year 2.
There was no significant difference between treatments in season average Ψleaf.
continues next month
For more information see Tree Fruit October 2014
