One of the objectives of the project* was to align tree responses to weather conditions in order to assess how climate affects dormancy and bloom timing.
Temperate fruit trees such as cherries employ dormancy as a strategy to survive cold weather without sustaining cold weather damage.
Dormancy is defined as a temporary suspension of visible growth of any plant structure containing a meristem (a growing point such as a bud) and the inability of that bud to resume growth.
To break out of the dormant state and begin bud break a period of cold (the accumulation of winter chill) AND a subsequent period of heat are required.
Effects of insufficient winter chill
Insufficient winter chill can result in a number of problems: reduced budbreak; delayed, uneven and protracted flowering periods; asynchronous bloom windows for pollination; reduced fruit set and yield; and even weakened leaf emergence.
Global warming could reduce chill and hence hamper the production of high-chill species such as cherries. So being able to quantify winter chill is critically important to predict bud burst and flowering timing under future climates.
Winter chill
Some things are known about winter chill, but there is a lot that is still unclear.
We know that there are optimum temperatures for chilling, that temperatures below –2C have nil effect on chill accumulation, and that high temperatures can reverse previously accumulated chill.
This helps for measuring chill. What doesn’t help is the numerous methods of measuring winter chill.
Measuring chill
Two common methods for measuring chill are the chill hours model (using chill hours (CH) as units) and the dynamic model (using chill portions (CP) as units).
Chill hours
The simplest model is the ‘chill hours’ model which simply measures the number of hours between 0 and 7.2C.
The problem here is that this model does not account for any warm periods that might ‘cancel out’ some of the chill already accumulated.
For a colder region, such as Huonville (Tas), this might not matter too much, but for somewhere warmer, such as Manjimup (WA), using chill hours might not be appropriate.
Research from California showed that CH varied widely year to year compared to the dynamic model.
Dynamic model
The dynamic model considers how the sequence of temperatures influence chill accumulation including the negative influence of high temperatures, and can thus account for any warmer periods during dormancy that might influence the amount of chill accumulated.
So what’s the problem?
We can measure chill, let’s just do it! Not so easy, there are many factors still unaccounted for. For example—when do we start measuring?
Our project has not found a relationship to visible tree signs like leaf drop.
Dormancy in fruit trees has been described in the scientific literature as starting from a critical temperature threshold, or at harvest, at 50% or 100% leaf fall, or anywhere from summer through to winter.
Traditionally the period for measuring chill for models has been from 1 May (1 November in northern hemisphere), but this date misses any early accumulation of chill. More recently the chill accumulation period has been measured from 1 March (1 September in northern hemisphere).
Research in California showed that chill accumulation can be significant in the earlier months, and our project showed that all cherry producing regions started to accumulate chill before May.
Additionally, the degree of variability in the starting date of the chill period is different between sites.
Huonville is particularly consistent in start date while Donnybrook (WA) and Applethorpe (Qld)show considerable variation.
Start of dormancy
So we can measure the start of chill accumulation—but is this the same as the start of dormancy?
The project is currently collecting data to assess exactly this.
Observations of tree stage have been made on a regular basis since the beginning of March in orchards from Tasmania, Victoria and Western Australia.
Laboratory observations of tree buds have also been made because there is no visible outward sign on the bud to indicate that it has truly entered dormancy.
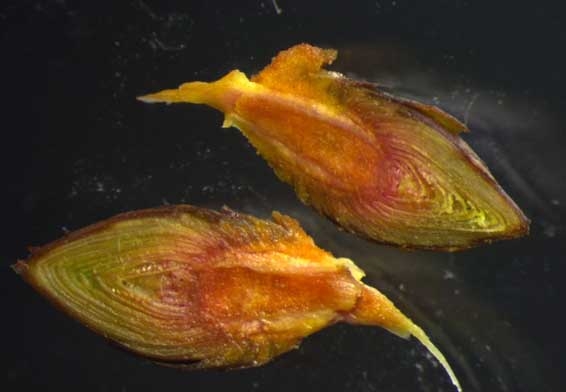
Buds were collected regularly and tested for respiratory activity using tetrazolium salt solution—a receptor for hydrogen ions released during respiration that induce a colour change—red (Figure 1).
It was anticipated that a reduction in colour would indicate the induction of dormancy. Equally an increase in colour would indicate dormancy release.
But this was only seen in one variety at one site. Interestingly, the red colour remained in the heart of the buds throughout dormancy, indicating that buds were physiologically active during dormancy.
Spanish researchers (Fadon et al 2013) at the 7th International Cherry Symposium suggested that accumulation and distribution of starch to developing flowers was occurring during dormancy.
A previous research project undertaken in Tasmania (Sustaining production in marginal climates) found that starch increased from summer to winter in Kordia buds, but not Sweetheart buds; and that Sweetheart buds had more starch than Kordia buds at each stage (Measham et al 2014).
End of dormancy
(continued next issue)
*Crossing the threshold: Adaptation tipping points for Australian fruit trees is a three year project which commenced in 2013 looking at cherry, apple and pear crops funded from the Department of Agriculture.
See this article in Tree Fruit Oct 2015