Accompanying this article is an Excel spreadsheet which presents a simple model for a three hectare planting over 20 years; save the model to your computer desktop.
Continued from last month
First worksheet has three sections
The first worksheet contains three sections, as follows:
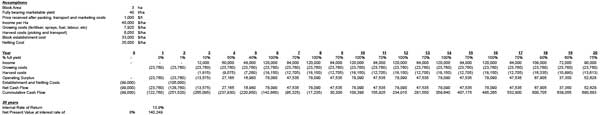
- The top section contains a set of assumptions about the project, including area, yield, price, and costs.
Changing any one of these assumptions will change the cash flow estimates across all the years and, therefore, the value of the key indicators - The middle section shows the expected cash flows across the 20 years. It starts with an estimate of the proportion of marketable yield. In the current example, you will see some biennial bearing (from 100% of expected marketable yield, down to 70%), but you might also change some percentages to indicate very poor years; because of frost, for example.
Also, the cost of netting could be excluded from the model, but it is then likely that the average price should be changed because packout could be lower - The bottom section shows the two key indicators. The internal rate of return is calculated by the model, but the discount rate can be changed manually, indicating a different assumption about alternative uses for the block investment cost.
For example, are we in a phase where alternative investment returns are more like 5% or 6% rather than 8%? Changing the discount rate changes the estimated surplus net present value gained from the investment. However, the internal rate of return does not change because it is based on the raw income and expense figures, not on the discount rate.
Conclusion
I hope you find this model of interest. Many growers would not normally have the opportunity of viewing a new block investment over its life, and applying your own assumptions to the model might help your understanding of the inflows and outflows across the life of a block.
You will know that changing one assumption may well imply that another assumption should also be changed.
If you want to add on more years feel free to do that by copying the middle section formulas across those additional years. However, please ensure that the internal rate of return and net present value formulas apply to all the years (the columns) you are considering.
You will note that this is a simple, possibly a simplistic, model. It can be imagined that models used within BHP Billiton prior to commencing a mine, or within Transurban prior to building a tollway, are significantly more complex.
The fact is, however, that a 20-year DCF model could be a highly inaccurate predictor of what could happen to a fruit block because so many events will affect the investment that some of them cannot be imagined yet, let alone their timing. For this reason, such a model might as well be simple.
If you care to consider DCF analysis, it is another factor in assisting your investment decisions and you can keep it simple, or make it more detailed, as you wish. This model may help to get you started, and can be applied to a range of business investments.
See this article in Tree Fruit April 2016