Because of the inherent timings that relate to growing fruit, it can be more complex to understand the financial implications of decisions for orchards than for some other types of agriculture.
One critical set of decisions are those around the planting of a new block.
Whilst a great deal of market and agronomic information will be reviewed in order to make the best decisions about each new block, the economic life of that block can be daunting to evaluate.
The establishment and development of a fruit block can be likened to infrastructure projects conducted by a range of businesses, and one of the tools used by those businesses to make an investment decision is that of discounted cash flow (DCF) analysis.
Available Excel spreadsheet
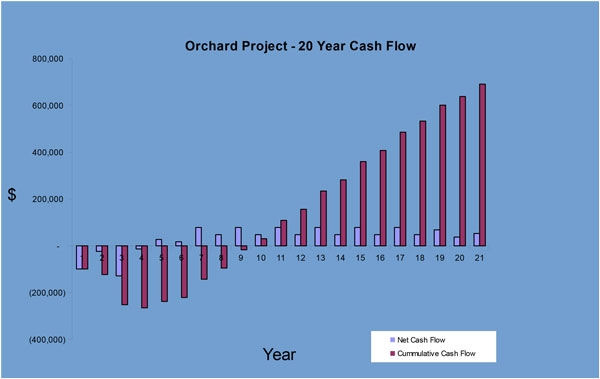
Accompanying this article is an Excel spreadsheet (see attachment below) which presents a simple model for a three hectare planting over 20 years; save the model to your computer desktop.
For those who are proficient in Excel, feel free to make as many changes as you like to better reflect your own situation (be careful with formulas).
For those who dabble in Excel, I hope you will find it interesting to change a figure here and there to see how changes in assumptions can make a difference to the economic outcomes.
DCF Principles
DCF analysis considers the flows of income and expenditure over the life of a project.
Therefore, in the case of a new fruit block, DCF analysis starts with the establishment cost of the block and then tracks the estimated income and expenditure over its expected life.
However, the value of money declines over time. What one dollar will buy today will typically cost more in a year’s time because the value of money has changed.
To allow for the difference in income and cost values over time, DCF analysis expresses the individual annual economic outcomes in the same value—what is called net present value.
This process is called discounting, and it also compares the return from this investment with the return that could have been earned from the same amount of money in an alternative investment.
Net present value enables the comparison of different types of investment.
You will see that the model uses a discount rate of 8%, which could relate to the long-term compound rate that might be earned from the sharemarket, for example.
DCF Indicators
The accompanying DCF model considers two economic indicators: the net present value from the project, and the internal rate of return.
(continued next month)
See this article in Tree Fruit February 2016
(Download the attachment below)


