One critical set of decisions are those around the planting of a new block.
Whilst a great deal of market and agronomic information will be reviewed in order to make the best decisions about each new block, the economic life of that block can be daunting to evaluate.
The establishment and development of a fruit block can be likened to infrastructure projects conducted by a range of businesses, and one of the tools used by those businesses to make an investment decision is that of discounted cash flow (DCF) analysis.
Available Excel spreadsheet (download attachment at end of article)
Accompanying this article is an Excel spreadsheet which presents a simple model for a three hectare planting over 20 years; save the model to your computer desktop.
Continued from last month
DCF Indicators
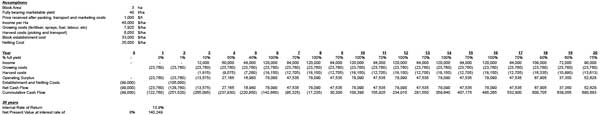
The accompanying DCF model considers two economic indicators: the net present value from the project, and the internal rate of return.
The model indicates a positive net present value of $140,249. This means that, at a discount rate of 8%, the project has covered its investment cost and made a return greater than 8%.
The second indicator, the internal rate of return, provides the rate that the investment actually does make given the assumptions behind the figures.
The internal rate of return is the compounded interest rate the investment will return after accounting for the benefits and costs of the investment. The model indicates an internal rate of return of 13.9%.
So, given the assumptions made, should this project go ahead? One school of thought is that a minimum internal rate of return of 25% is required for an agricultural project because of the inherent risk over such a long time. This may or may not be too conservative.
However, DCF analysis is only one factor in making a final decision and a grower could use such an analysis in whatever way might help to make that decision.
The Model—3 worksheets
When you open the model you will see three worksheet tabs at the foot of the screen, as follows:
- The first worksheet contains the cash flow model itself, including the internal rate of return and net present value indicators;
- The second worksheet presents cash flow graphically, showing the flow from negative to positive cumulative cash flow over time; and
- The third worksheet works up some of the background data behind the assumptions.
First worksheet has three sections
The first worksheet contains three sections, as follows:
The top section contains a set of assumptions about the project, including area, yield, price, and costs.
Changing any one of these assumptions will change the cash flow estimates across all the years and, therefore, the value of the key indicators;
The middle section shows the expected cash flows across the 20 years. It starts with an estimate of the proportion of marketable yield.
(Continued next month)
See this article in Tree Fruit March 2016