Data for the pome fruit industry is not perfect, but it appears to be consistent. My observations of summerfruit industry information are that it can produce quite volatile results. I will therefore discuss trends rather than what is happening from year to year.
In addition, cause and effect may not be clear. Why things happen can be based on a complex mix of reasons. What insights I can deduce below are at least based on objective data.
Please note that ABS changed its collection database in 2005–06. Whilst I am assuming that production data might be consistent over a long period, monetary data needs to be treated with caution.
Businesses
ABS agricultural data refers to ‘establishments’. This term refers to, “the smallest accounting unit of business controlling its productive activities and maintaining a specified range of detailed data enabling value added to be calculated. The majority of establishments operate at one location only”.
So the term nearly refers to individual orchard businesses, but not quite—a large business might own more than one establishment.
Drop in the number of establishments
Let’s start with the number of establishments in Australia’s summerfruit industry.
In 1998 there were 1307 stone fruit growing establishments; by 2011 there were 841, a decrease of 36%, or 36 establishments a year.
These figures equate to an annual decrease of 2.7%, slightly more slowly than for pome fruit establishments.
To put this into context, the consolidation of all other agricultural industries during the same period was 6%. The summerfruit industry, like the pome fruit industry, is consolidating at a much faster rate than agriculture in general.
It appears therefore, that the overall deciduous tree fruit industry is consolidating at a significantly faster rate than agriculture in general.
Where has the consolidation occurred?
If we take the decline of 36% as the national average then: the decline was about 50% in New South Wales and South Australia; Queensland, 42%; Western Australia, 32%; and Victoria, 6%. Tasmania’s industry expanded by 338%, albeit from a low base, probably due to cherry plantings.
If we consider establishment size, between 1998 and 2011 summerfruit growing establishments declined across each size range. However, the proportion of establishments in each size range remained the same between those years—which suggests that consolidation is occurring equally across the industry, regardless of business size.
 The production base
Figure 1 indicates the production base trend over the past 15 years. This seems to present an encouraging picture for the industry.
Despite consolidation, growers were expanding their investment in new plantings and this suggests a degree of confidence about the future.
Plantings increased through the last decade, but now seem to be plateauing. Peaches especially, may have been influenced by lower processing intakes in the Goulburn Valley.
I feel that some summerfruit investment is being driven by poor or mature returns from pome fruit; this observation may apply to cherries in particular. Fresh peach and nectarine plantings were also encouraged by potential trade to Taiwan. It was a shock for the industry when this market was closed, although it has more recently reopened. And whilst the potential for production growth is encouraging it will beg the perpetual questions around the impact on returns.
Although it would be interesting to note the planting density figures for each crop, any derived figures would only be valuable if they could be compared to a major competitor. I currently can’t source the data to do that.
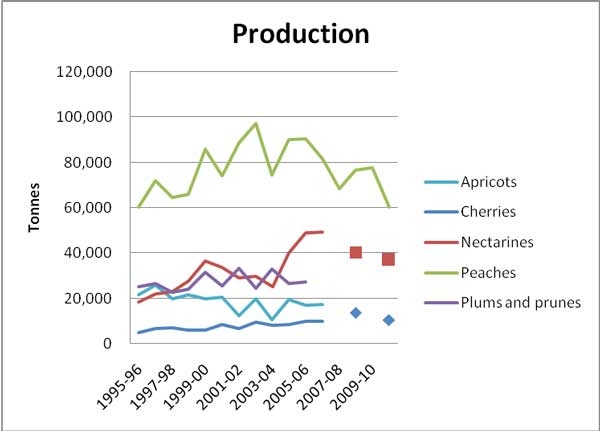
Production
The chart of gross production (Figure 2) is interesting given the foregoing chart about trees. The scale is a little distorted because total peach production is high compared to the other crops.
It would appear that the surge and then fall in peach tree numbers is reflected in peach production, and may largely be driven by changes in the processing market.
Nectarine production also declined to less than 40,000 tonnes by 2011 to reflect a stabilisation in tree numbers.
I would have expected cherry production to be on an upward trend, but this crop can be highly susceptible to seasonal conditions and these may have come into play. That crop’s potential production is higher than has been obtained to date.
Consumption
The elements that comprise national consumption are: production, exports and imports. Production has already been considered.
Export trends
Figure 3 presents export trends based on FAO data.
Export volatility for some crops is clearly apparent. The trends seem to indicate that exports of apricots, and peaches and nectarines (combined figures) have declined since about the start of the drought—this reflects the export history for pome fruit.
The decline in apricots and peaches may also be linked to less production going overseas from SPC Ardmona.
The picture for the developing cherry industry is encouraging. Although coming from a low base, exports are increasing steadily.
Apparent consumption
Figure 4 includes FAO import information to provide a picture of apparent Australian consumption. Again, the chart is distorted by the relatively larger peach and nectarine figures.
Apricot consumption is declining, as is peach and nectarine consumption, although the latter may be influenced by declining production.
Plum consumption is steady. Cherry consumption appears to be increasing, encouraged by higher domestic production and imports during the Australian off-season.
Yield
Australian agriculture has suffered declining terms of trade for at least 20 years (Productivity Commission). That is, crop input costs have risen faster than crop returns.
Yield has been the vital factor that has allowed Australian farmers to maintain or increase their income, and horticulture is no exception to this need.
Alarming figures
Table 1 presents a view of summerfruit crop marketable yield. Figures for apricots, peaches and nectarines, are alarming for Australia.
There may well be reasons behind this that are connected with processing tonnages, but our indicative marketable yields seem well behind our competitors.
I tend to think that hectare data held by FAO is not correct, however, their other summerfruit data is consistent with ABS information.
Cherries positive
As for other benchmarks noted above, cherry growers appear to be making positive strides.
Competitive with Europe and within touch of the USA, the industry’s investment in higher-density, covered plantings, looks promising for the future.
Returns
Figure 5 presents annual average gross values per kilogram (at 2011 values—based on the annual CPI indices for food).
As previously noted, the data prior to 2005–06 is taken from a different database to that used from that year on. My impression is that prices for all summerfruit crops have declined slightly during the last few seasons. Coupled with plateauing production, this aspect of business would not be welcome.
Supermarket influences
The increase in market control by Coles and Woolworths will continue to influence industry development.
Their strategies will drive: fewer suppliers, greater control of the supply chain to gain economic efficiencies, and a strong push for market growth driven by price discounting on key consumer products.
The outcomes from these are already being felt by horticulture farms that supply food processors —processed fruit being a prime example.
Despite the general angst felt by the farming community in this environment, there will be fruit businesses which will benefit from new alliances.
The Income Equation
Gross farm income is derived from a simple equation:
Gross Income = Area (hectares) x yield (tonnes per hectare) x return (dollars per hectare)
For a grower to increase gross income, they must increase any one, or a combination of these elements. Alternatively, if a grower cannot increase any of these elements, then their net income (gross income less costs) must decline, given rising costs.
My previous analysis indicates that:
- The number of summerfruit businesses is declining at a little less than 3% per year. Consolidation is taking place amongst all sizes of business;
- There are promising signs that the cherry industry could be internationally competitive and that marketable yields are heading in the right direction. However, Australian yields of other summerfruit crops seem to be below competitive levels. The capacity to continuously increase yield is fundamental to long-term sustainability;
- The situation for gross value is that prices for all summerfruit crops may have plateaued during the past few seasons.
Overall view
At this stage the data shows an industry that might be maintaining its rate of gross income, but may not be increasing it.
Given that annual costs will be increasing, my overall view is that summerfruit growers would be working hard to increase their income each season, and numbers of establishments are regularly closing down.
Profitability
The grains, dairy and livestock industries are made up of businesses that sell common products into common markets. Although there are certainly differences between individual businesses there is a lot of published data about farm profitability.
That is not the case for horticulture. Individual marketing skills make all the difference between a good return and a poor one and there are different supply chains that growers may use.
As a result, horticultural growers have traditionally been protective about their financial results and there is little published data.
Although canning peaches were included in a six-year benchmarking study I undertook in the Goulburn Valley, I am not aware of any longitudinal studies that provide an insight into summerfruit crop profitability.
Debt
In a difficult business environment it is vital that debt is managed well.
However, profits are the biggest contributor to managing debt and, if profitability is declining, debt must increase.
It also becomes harder to invest in new plantings and technologies, and takes individual businesses to the point where they may not be able to survive a poor year. Banks have tightened their lending protocols and once-ready credit is not there anymore.
An ABARES report identified that, between 2009 and 2010, the debt of the sample horticultural farms in the Goulburn-Broken catchment increased from $338,000 to $679,000.
The ABARES sample may not be representative of general business, but it is one recorded viewpoint. Its finding also tends to confirm what many in the industry seem to feel—these are challenging times.
Conclusions
The summerfruit industry has been subject to a number of dynamics, including the following:
- Peach production is being adversely affected by the reduction in Goulburn Valley processing intake. Further decline is expected
- Fresh market nectarine and peach plantings increased strongly on SE Asian opportunities but growers were badly affected by the closure of the Taiwan market
- Cherry production has increased as pome fruit growers experienced some stagnation. Exports are performing well
- Cherry yields have developed well and are looking competitive, however, yields of other summerfruit crops seem low by international standards
- Average gross value for all summerfruit crops has declined during the past two seasons.
Despite some setbacks, my impression is that summerfruit growers have invested as opportunities arose, and that demonstrates confidence in their crops.
Cherry growers in particular have produced some very positive outcomes.
As SE Asian trade opens up again, part of the industry’s future will be aligned with its ability to increase exports, thereby giving domestic sales the chance of higher returns.
To see all the graphs and tables, goto October 2012 Tree Fruit